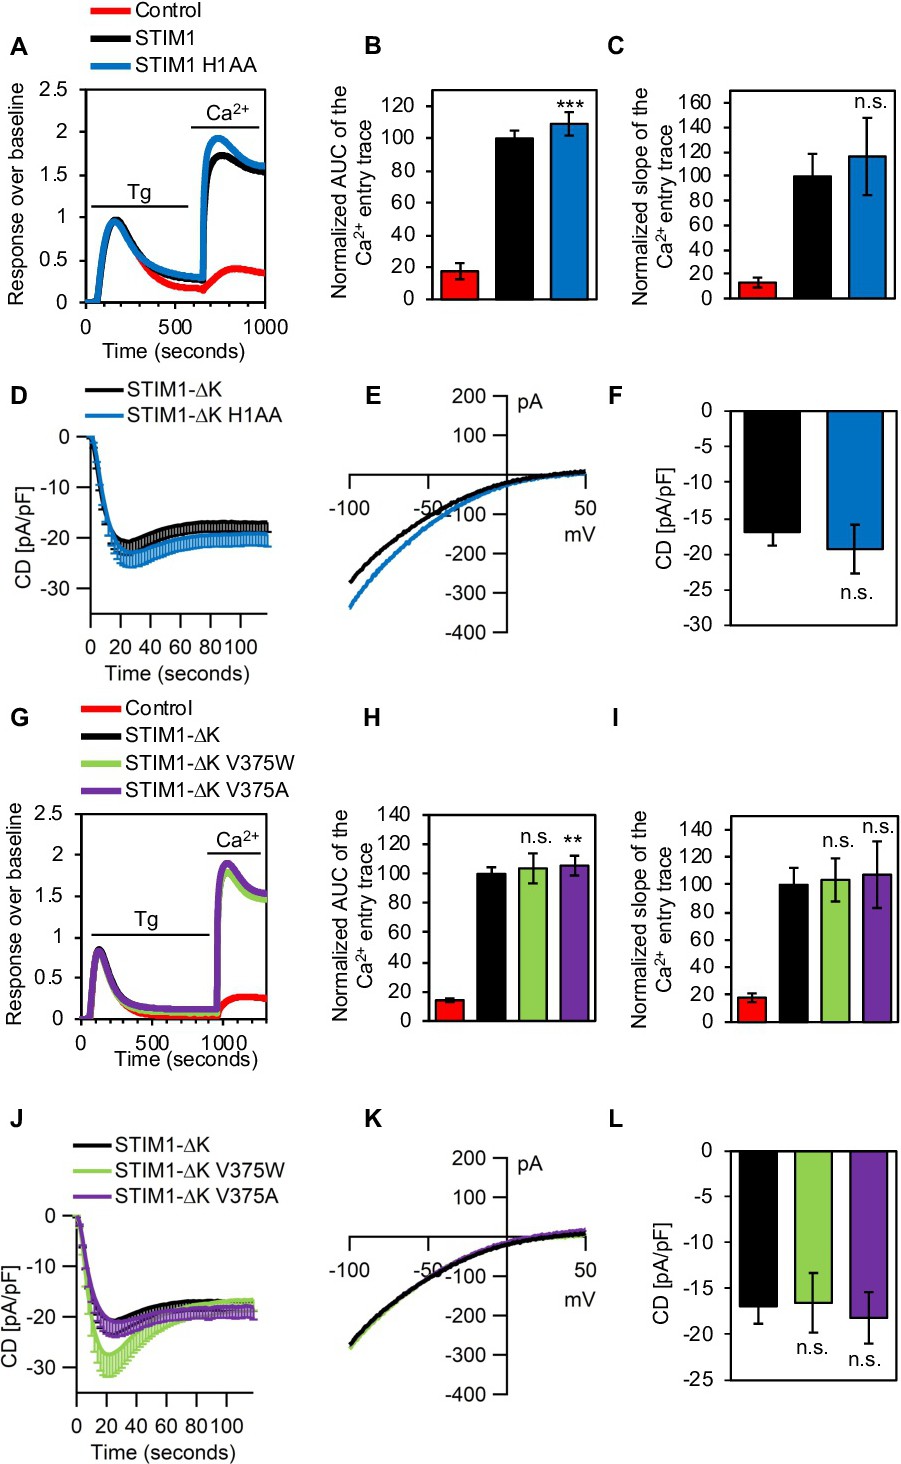
Fig. 4. The H1 site residues of STIM1 CaM-binding domain are dispensable for Orai1-activating function of STIM1. (A), Representative FLIPR traces of SOCE in HEKO1 STIM1-/- cells transiently transfected with mCherry (Control, red), mCherry-STIM1 (STIM1, black) or mCherry-STIM1-L374A-V375A (STIM1 H1AA, blue). 1 µM thapsigargin (Tg) and 2 mM CaCl2 (Ca2+) administrations are indicated. (B), Quantified area under the curve (AUC) and (C), slope of the SOCE traces after extracellular Ca2+ application in HEKO1 STIM1-/- cells transiently transfected with control (red), STIM1 (black) or STIM1 H1AA (blue). The data was normalized by setting the AUC and slope of the Ca2+ entry traces to 100 (n = 15; mean ± standard deviation). (D), average current density (CD) of the ICRAC recordings (STIM1-∆K, n = 15; STIM1-∆K H1AA, n = 7; mean - SEM) from HEKO1 STIM1-/- cells. (E), average current-voltage (I-V) curves of the ICRAC recordings at t = 2 min from the traces shown in D. (F), quantified average CD values at t = 2 min (STIM1-∆K, n = 15; STIM1-∆K H1AA, n = 7; mean ± SEM) from HEKO1 STIM1-/- cells transiently overexpressing STIM1-∆K (black) or STIM1-∆K H1AA (blue). p value (p) of the STIM1- or STIM1-∆K H1AA mutant compared to the STIM1 or STIM1-∆K group, respectively is indicated above the respective bar as non-significant (n.s.) for p > 0.05 or "***" for p ≤ 0.001. (G), Representative FLIPR traces of SOCE in HEKO1 STIM1-/- cells transiently transfected with control (red), STIM1-∆K (black), STIM1-∆K V375W (green) or STIM1-∆K V375A (purple). (H), Quantified area under the curve (AUC) and (I), slope of the SOCE traces after extracellular Ca2+ application shown in G. The data was normalized by setting the AUC and slope of the Ca2+ entry traces to 100 (n = 18; mean ± standard deviation). (J), average current density (CD) of the ICRAC recordings (STIM1-∆K, n = 15; STIM1-∆K V375W, n = 6; STIM1-∆K V375A, n = 10; mean - SEM) from HEKO1 STIM1-/- cells. (K), average I-V curves of the ICRAC recordings at t = 2 min from the traces shown in J. (L), quantified average CD values at t = 2 min (STIM1-∆K, n = 15; STIM1-∆K V375W, n = 6; STIM1-∆K V375A, n = 10; mean ± SEM) from HEKO1 STIM1-/- cells transiently overexpressing STIM1-∆K (black), STIM1-∆K V375W (green) or STIM1-∆K V375A (purple). p value (p) of each of the STIM1-∆K Val375 mutant compared to the STIM1-∆K group is indicated above the respective bar as non-significant (n.s.) for p > 0.05 or "**" for p ≤ 0.01.